
Sbs Wealth Kiwisaver Scheme
Sbs Wealth Income Fund

The Smiths take
Sbs Wealth Income Fund Smiths Rating B
Smiths' editorial rating, our internal opinion based on 10-year returns, fees, and risk band fit. Not a formal credit rating or regulated star rating.
Smiths reviews this fund against every other defensive option in NZ on net-of-fees returns, total fees, and band fit. The full Sorted snapshot is below.
General information only · Past performance is not a reliable indicator of future performance · For personal advice please contact us.
At a glance
This fund is for investors seeking
Three quick reads for whether the Sbs Wealth Income Fund fits your situation.

A 1+ year timeframe
This is a defensive KiwiSaver fund. The provider's recommended minimum holding period sits in the 1+ year range.
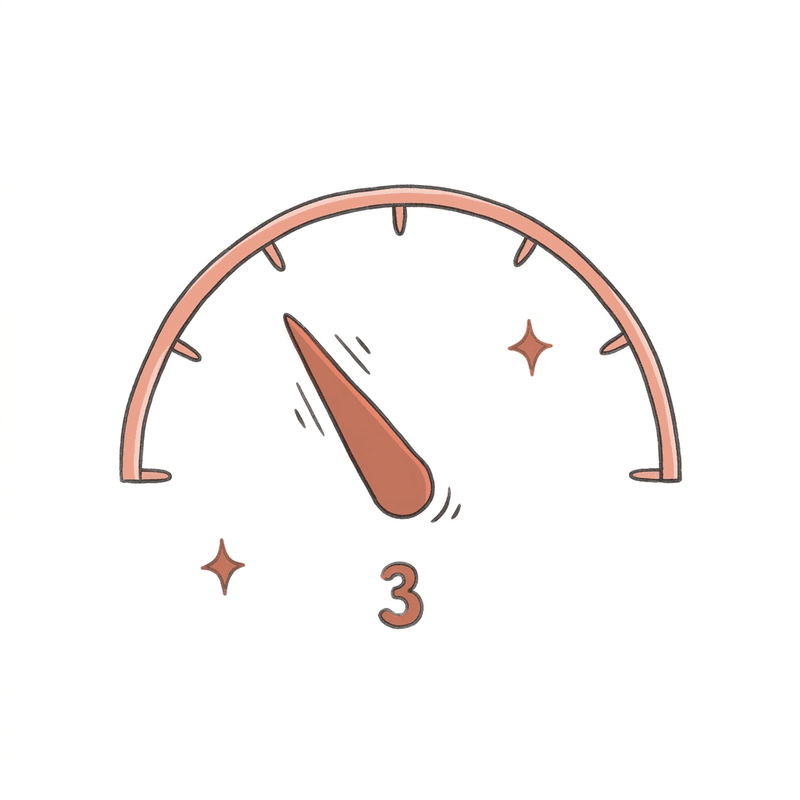
A moderate-risk investment
Sorted's risk indicator places this at 3 on a 1–7 scale. Smaller swings, lower long-term returns.
Mostly income assets
0% growth assets (shares, property) and 100% income assets (bonds, cash). Spread across multiple asset classes.
Snapshot
The headline numbers
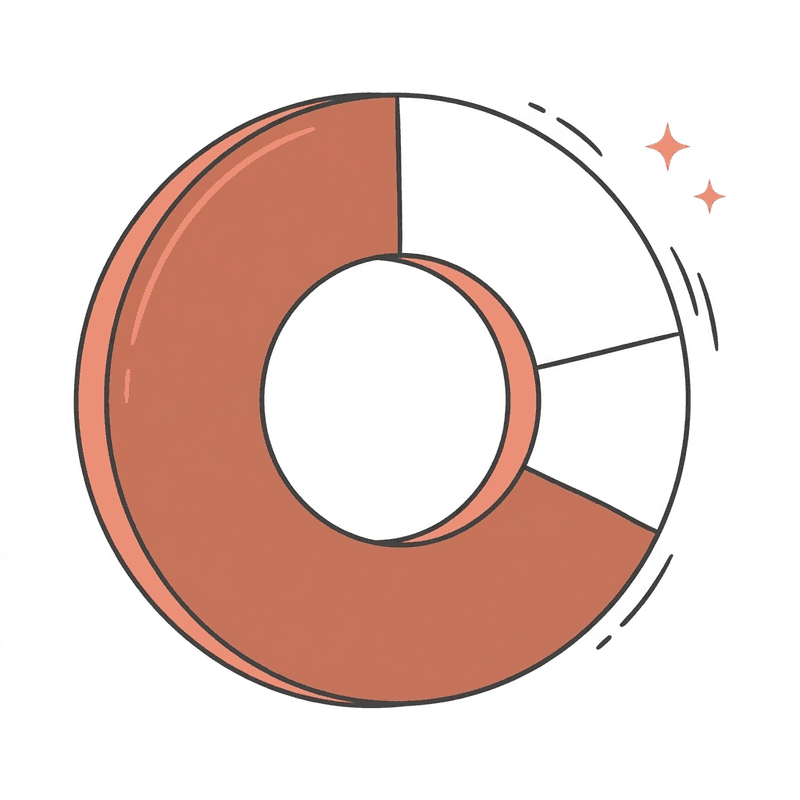
Mix
0.00% / 100.00%
Growth / Income · avg 0.36% / 99.64%

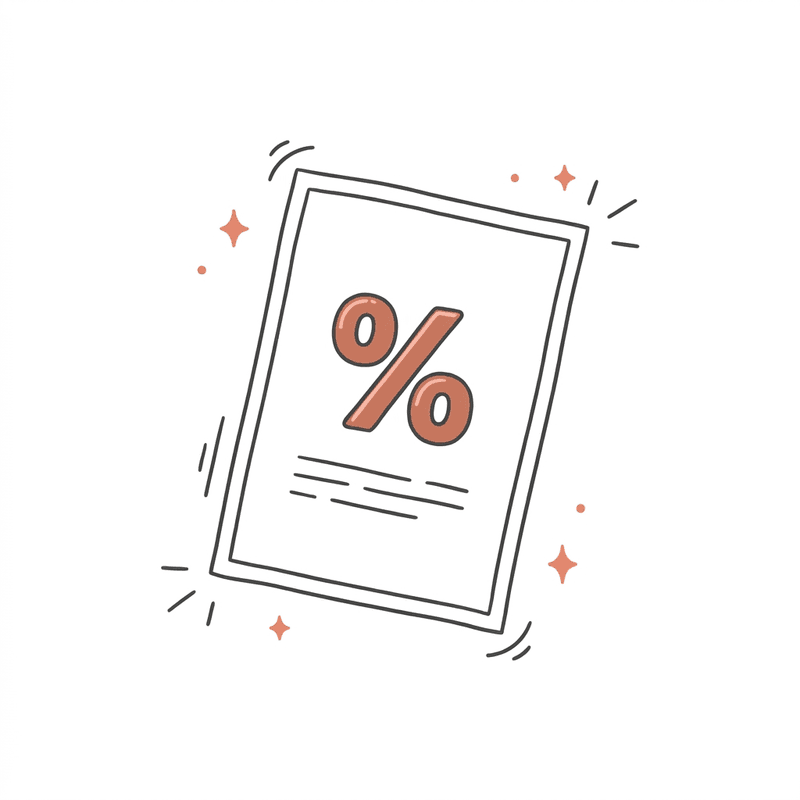
Fees
0.87%
$261 on $30k · avg 1.22%

5-yr return
0.05%
Annualised, after fees & 28% PIR
What the provider says
In their own words
“The fund aims to provide investors with a low-risk investment option that invests predominantly in income producing assets, the majority of these being cash and fixed interest investments. The Fund may also hold high dividend yielding equities and/or listed property and infrastructure investments.”
- Fund start date
- 14 October 2015
- Withdrawal rules
- This is a KiwiSaver fund. generally you can withdraw only to purchase a first home, after the age of 65, or in cases of significant financial hardship.
Asset mix
What this fund actually holds
Growth assets are 0.00% of the fund, income assets the rest. The mix is the latest snapshot from Sorted, with the average for this risk band's KiwiSaver funds shown alongside.
- Sharesthis fundavg
0.00%
avg 0.23%
- Propertythis fundavg
0.00%
avg 0.14%
- Otherthis fundavg
0.00%
avg 0.00%
- Bondsthis fundavg
92.03%
avg 50.54%
- Cashthis fundavg
7.97%
avg 49.09%


What it owns
Top 10 holdings. 94.54% of the fund
The rest is spread across hundreds of other positions. Full holdings live in the provider's portfolio file.
Harbour Nz Core Fixed Interest Fund
Bonds
New Zealand Fixed InterestNZ29.48%Dimensional Global Bond Sustainability Pie Fund
Bonds
International Fixed InterestNZ27.42%Ishares Global Aggregate Bond Esg Ucits Etf Nzd Hedged
Bonds
International Fixed InterestIE23.19%Dimensional Two-Year Sustainability Fixed Interest Pie Fund
Bonds
International Fixed InterestNZ5.01%Dimensional Five-Year Diversified Fixed Interest Pie Fund
Bonds
International Fixed InterestNZ3.82%Cash Deposit (Anz Bank)
Cash
Cash and Cash EquivalentsNZ1.75%Sbs Bank 07/03/2029 6.14%
Bonds
New Zealand Fixed InterestNZ1.54%Sbs Bank 18/03/2027 4.32%
Bonds
New Zealand Fixed InterestNZ0.82%Southland Building Society Term Deposit Maturity 21/08/26
Cash
Cash and Cash EquivalentsNZ0.76%Southland Building Society Term Deposit Maturity 24/06/26
Cash
Cash and Cash EquivalentsNZ0.75%
Fees breakdown
What you actually pay
Modelled on a $30,000 balance held for one full year. Each line shows this fund's % and dollar cost vs. the average for funds in the same risk band.
Management
Charged by the fund manager, % of your balance.
0.50%
avg 0.47%
$150
avg $140
+0.03%Other
Other potential costs not in the categories below.
0.00%
avg 0.23%
-
avg -
−0.23%Performance-based
Higher when the fund (or underlying fund) performs well.
0.00%
avg -
$0
avg -
Membership
A flat annual fee, regardless of balance or performance.
0.00%
avg 0.05%
$0
avg $15
−0.05%
Total combined fees
Doesn't include fees for one-off activities like transferring or withdrawing.
0.87%
avg 1.22%
$261
avg $366
Yearly returns
0.05% per year over 5 years
Each bar is the 12-month return ending in March, after fees and 28% PIR. Past performance is not a reliable indicator of future performance.
Returns: living in the past
Seeking returns is the point of investing, but the ones shown above are already gone. they won't continue. Pick a fund based on the right mix for your situation and reasonable fees, not on past returns.
Risk indicator
Sorted risk rating: 3 of 7
The Sorted risk indicator is calculated from the last 5 years of price volatility. Higher = more ups and downs but typically higher long-term returns.
Fund details
The unsexy stats that matter
- Total fund value
- $271,296,153
- Members
- 11,819
- Asset liquidity ratio
- 97.04%
- Debt ratio
- 0.15%
- Default KiwiSaver fund
- No
- Fund reference
- FND2871
Manager
Sbs Wealth Kiwisaver Scheme
Licensed with the Financial Markets Authority.
- NZBN
- 9429036803323
- FSP number
- FSP3961
Smiths Health Check
Is the Sbs Wealth Income Fund actually the right fund for you?
Take the 90-second Health Check. We'll grade your current setup, tell you what it's costing you, and recommend the best fit from our advised panel, benchmarked against every fund in the directory, not just sbs.
Our directory covers every NZ KiwiSaver fund. Our advice panel is five schemes (ANZ, Booster, Fisher Funds, Generate, Milford); recommendations land on four funds across Milford and Booster — how we're paid →